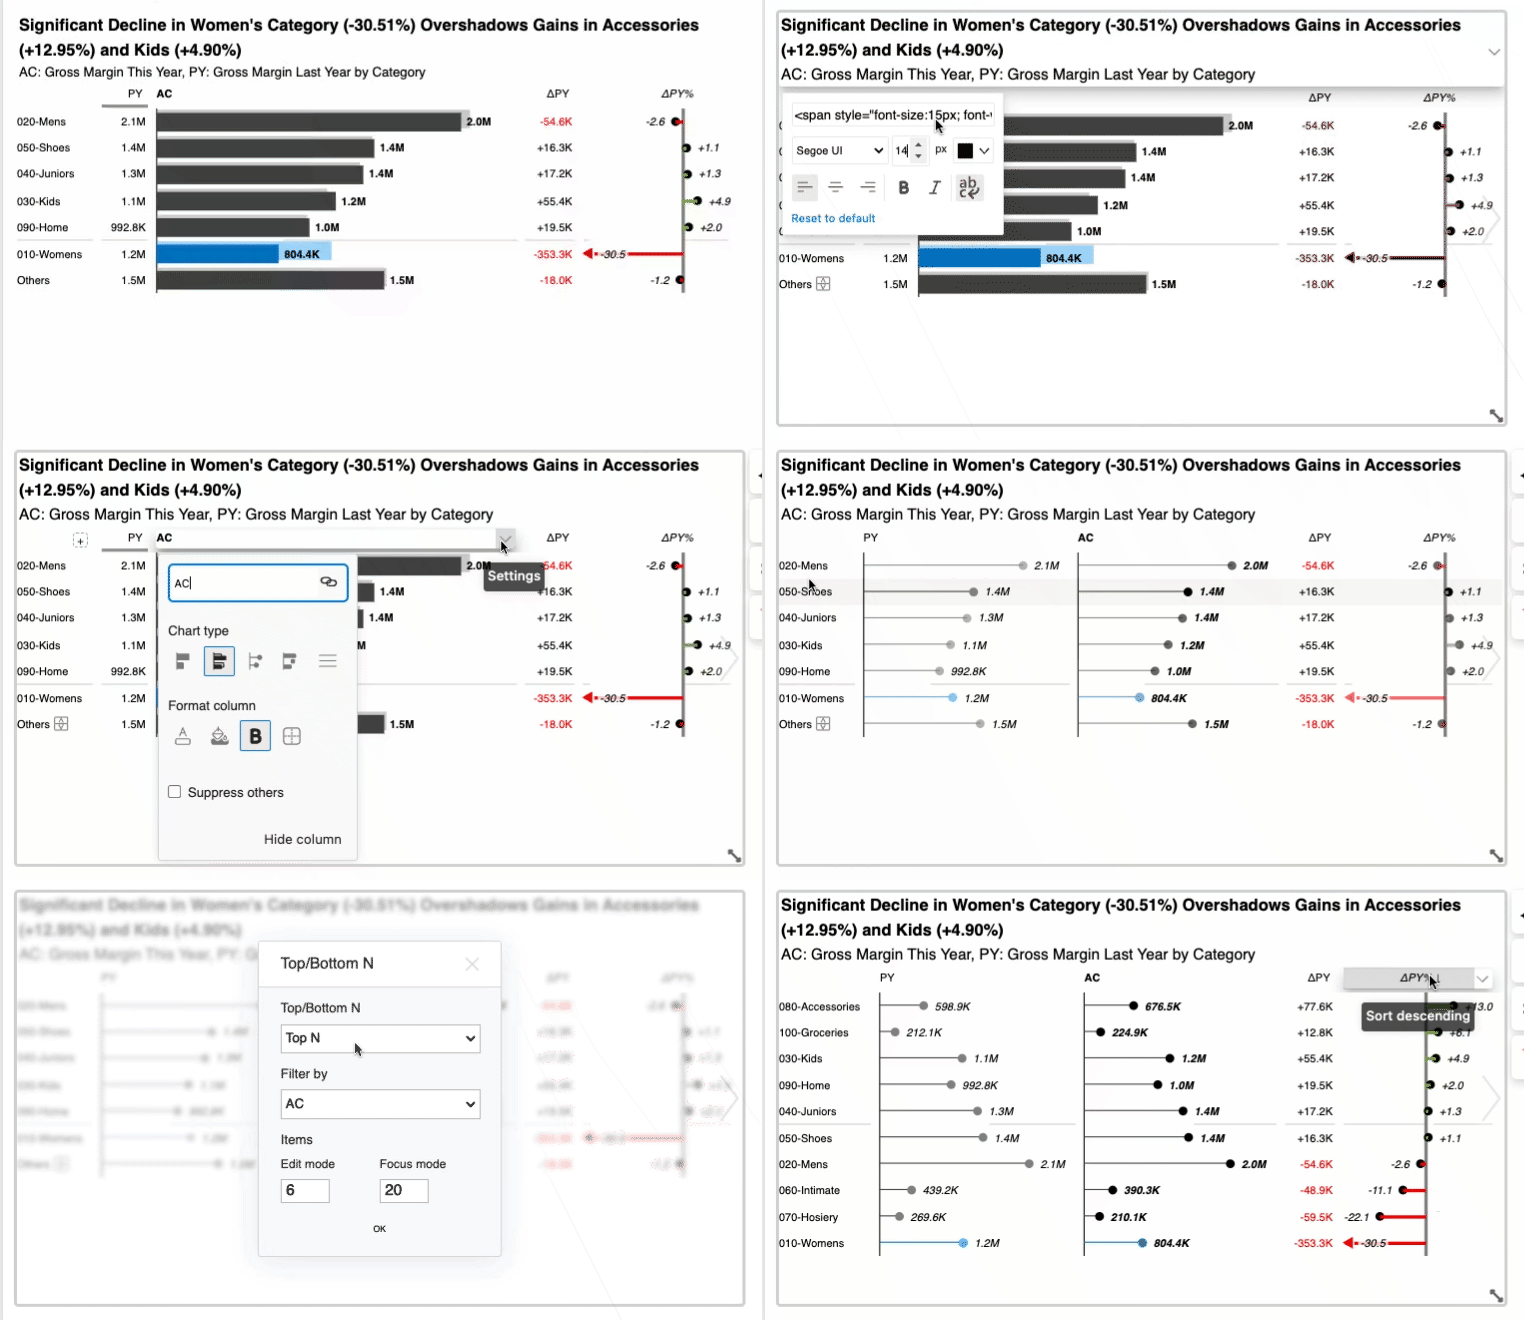
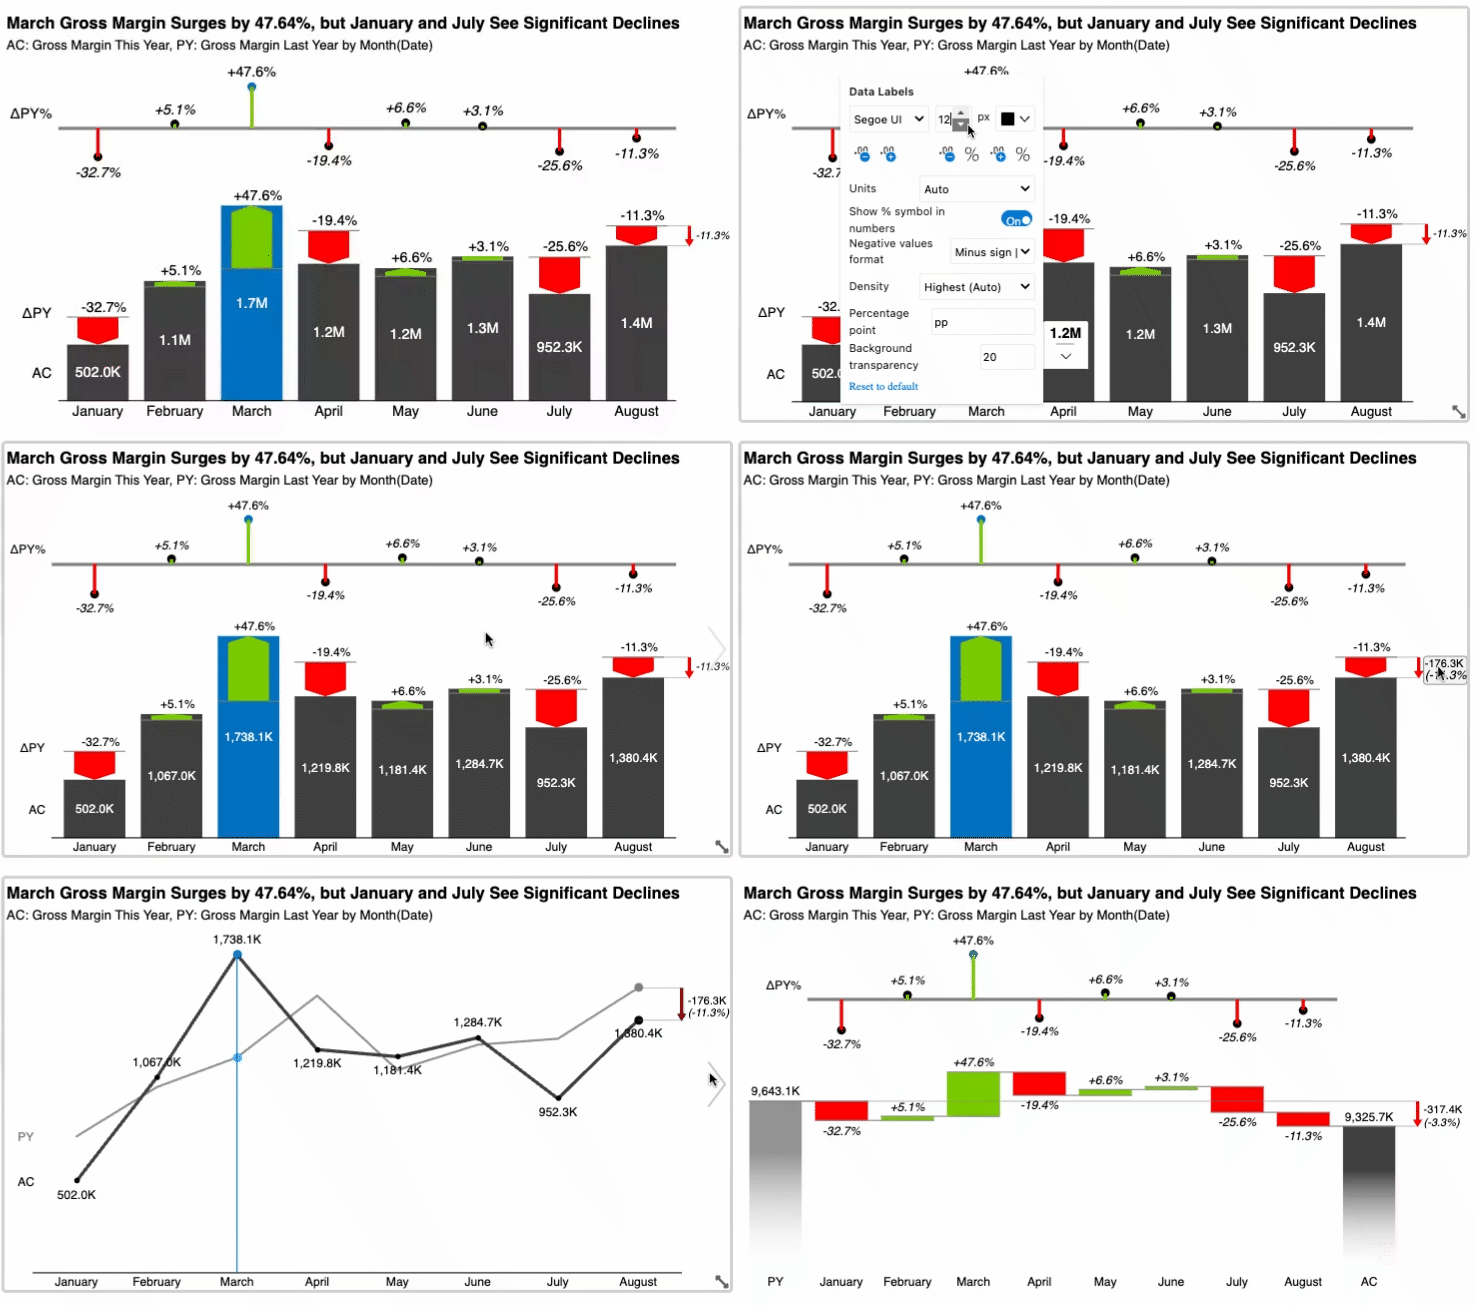
Zebra AI integrates two powerful visuals from Zebra BI: Tables and Charts. Both are responsive, deeply customizable, and optimized for financial and business reporting. Below is what you can do with each, how to switch between them, and some highlighted features.

Switch between Tables and Charts
- Open the chart’s editor (hover the visual and click the editor, or tap once on touch devices).
- Go to Visual Settings.
- Use the toggle to select Charts or Tables.
Zebra BI Tables — key capabilities

- Financial-grade tabular visuals with integrated charts in rows/columns.
- Sorting, freezing, and category formatting tuned for large reports. Toggle the sort order by clicking on the header of interest.
- Automatic absolute and relative variance calculation.
- Top N + Others grouping to focus attention. Right click on the categories and select the option from the context menu.
- Custom row level formulas and quick calculated measures where applicable.
- Scenario formatting for Plan/Forecast/Previous Year columns.
Zebra BI Charts — key capabilities

- Multiple chart types: column, bar, line, area, waterfall, and variance, from the Chart slider.
- Automatic variance calculation and highlighting for clear comparisons.
- Vertical axis toggle to switch between horizontal and vertical display.
- Rich data label controls: decimals, percentage formatting, negative value formats, variance label options. Hover over data labels to reveal the settings menu.
- Scenario visualization: Plan, Forecast, and Previous Year styling for clear scenario storytelling.
Why and when to switch
- Use Charts when you need trend, composition, or variance visuals to tell the story at a glance.
- Use Tables for dense financial statements, category-level performance, and detailed comparisons with totals and hierarchies.
- Switch anytime as your story evolves; settings map across to preserve intent.
Styling and consistency
- Styles are applied per story and influence both visuals (colors, fonts, patterns).
- As you switch or add visuals, they inherit the active story style, ensuring a consistent look.
- Visual-specific styling settings override the story-level custom styling settings.
Learn more
For detailed features, advanced formatting, and best practices, refer to the Zebra BI Knowledge Base: