Changelog
March 10, 2026
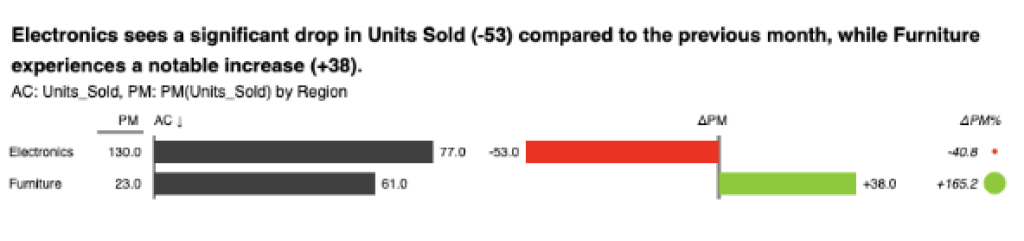
- Month-over-month comparisons out of the box – Zebra AI can now automatically generate month-to-month comparisons, enabling meaningful trend analysis even when multiple years of historical data are not available.
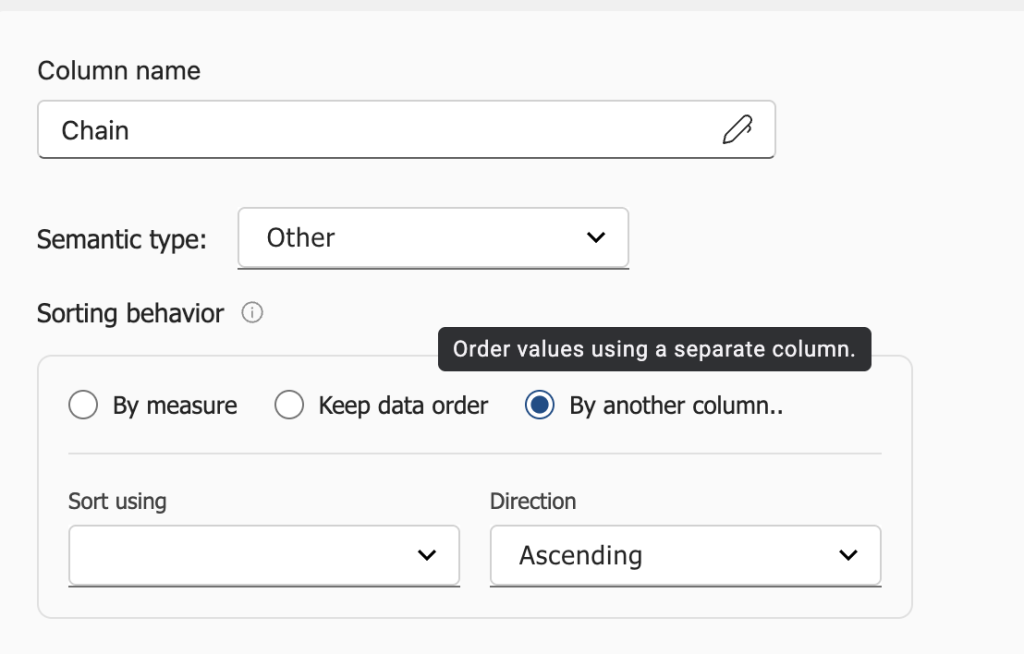
- Custom dimension sorting based on another column – Sort categories using values from another metric or column (for example ranking products by margin or contribution), enabling clearer financial analysis.
- Collapsible chat messages in Stories – Keep your narrative focused by collapsing intermediate analysis steps while preserving the reasoning behind results.
- Edit or remove the last chat message – Quickly refine the latest step in your analysis without restarting the conversation.
Improvements
- Various bug fixes and stability improvements across the chat and story experience.
January 23, 2026
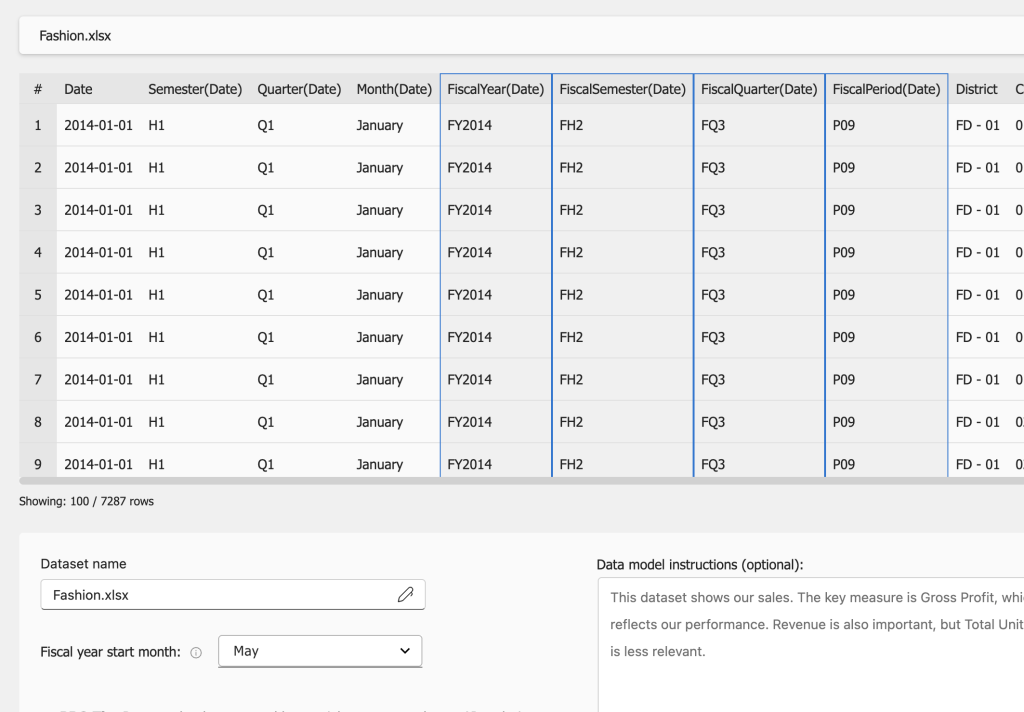
- Fiscal year support – Define a custom fiscal year start month in the data configuration step. All time-based analyses, filters and visuals automatically respect your fiscal calendar by default.
- Custom sorting by user intent – The AI agent can now sort results according to your instructions (for example ranking products by revenue, or revenue growth compared to a different period, ascending/descending etc.).
Improvements
- Improved PowerPoint export – Multiple stability improvements and the ability to export two visuals per slide for more compact presentations.
- Multiple stability improvements & minor bugfixes
December 30, 2025
- Two-level hierarchies in tables – Analyze hierarchical structures such as Region → Country, Category → Product, or financial account groups → individual accounts, making it easier to explore both operational and financial breakdowns directly in Zebra BI Tables.
- Grand total row – Tables now automatically show a clear grand total for easier interpretation.
- Editable dashboard headlines – Customize the main message of your dashboard to highlight key insights.
- Dashboard refresh – Quickly refresh dashboards when underlying data changes.
- Story copying – Duplicate an existing story to reuse analysis or create variations.
Improvements
- Smarter data upload validation – The upload experience now surfaces potential data issues earlier and provides clearer guidance when cleaning datasets.
November 12, 2025
- UI connection support for non-Premium Power BI datasets – Connect to standard Power BI datasets and select columns Zebra AI should analyze using the friendly selection UI.
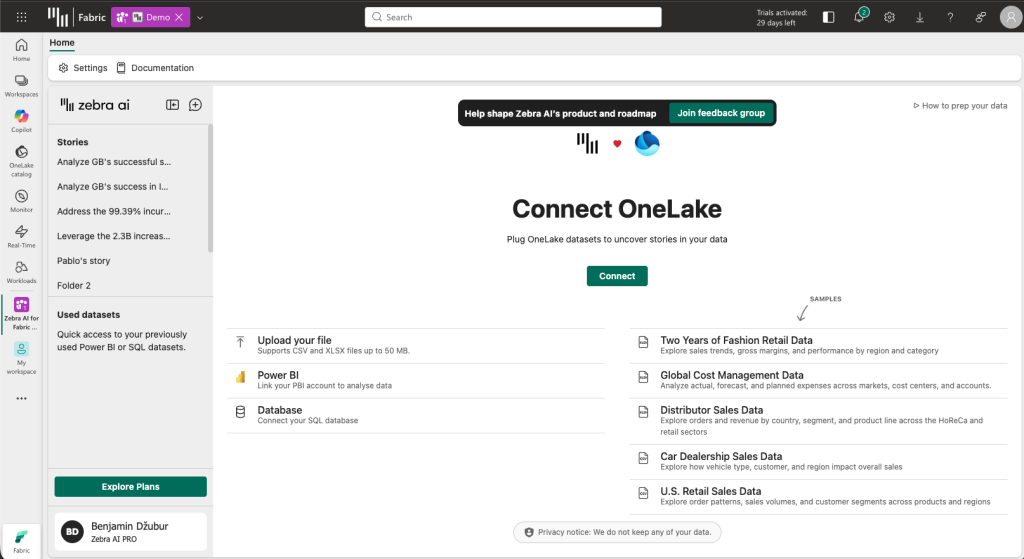
- Exports within Microsoft Fabric added – Easily export results and dashboards to Excel and PowerPoint as part of Zebra AI for Fabric.
- Miscellaneous:
- Improved AI reasoning and more structured analytical outputs.
- Minor UI fixes and stability improvements.
September 18, 2025
- Introducing Zebra AI for Fabric – Run Zebra AI analysis directly within Microsoft Fabric environments.
- Zebra AI for Fabric additinoally supports OneLake Warehouse connections
- Improved handling of datasets with partial-year data, ensuring accurate comparisons and time-based insights.
- Miscellaneous:
- Reduced latency for faster responses.
- Mobile UI fixes and several minor usability improvements.
- Introducing Zebra AI for Fabric – Run Zebra AI analysis directly within Microsoft Fabric environments.
August 28, 2025
- Introducing the Chat Agent:
- The chat experience has been greatly improved in terms of reasoning ability and UX.
- The chat thinks, performs sequential analyses and builds visualizations in multiple turns before returning the final answer, allowing it to perform more complex and deeper analysis.
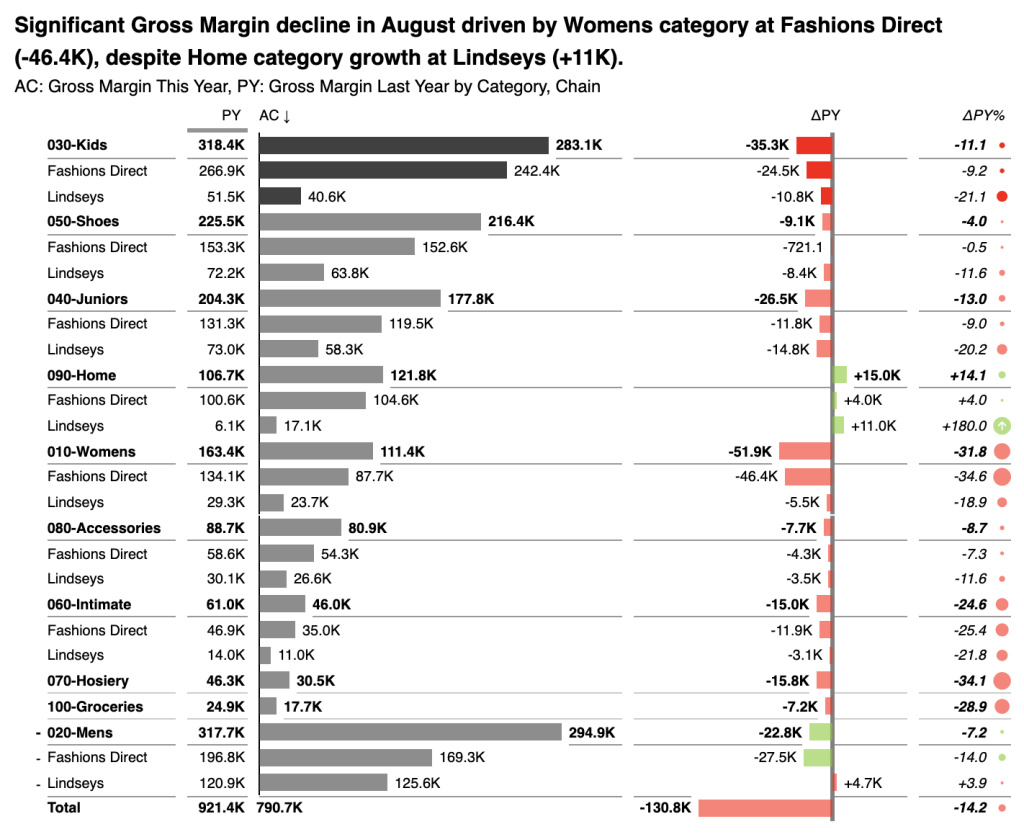
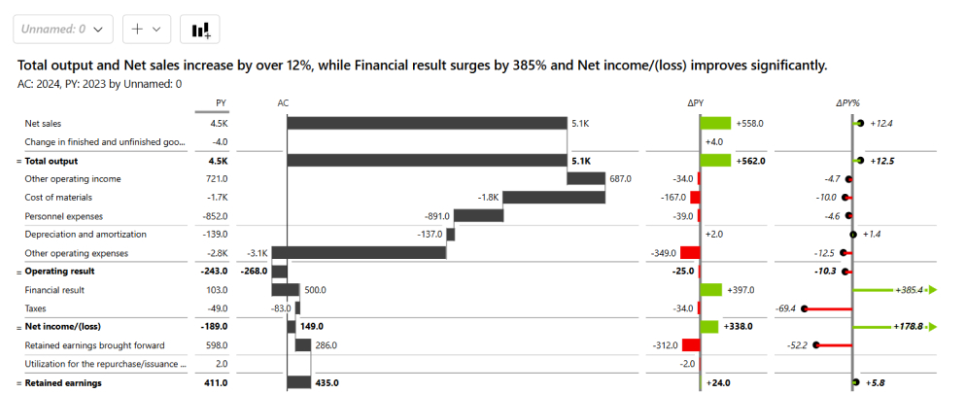
- Better dashboards for Financial statements!
- When you connect financial data — P&Ls, cash flows or balance sheets — Zebra AI will automatically recognize it and build a waterfall chart with inverts and results set to the appropriate accounts.
- Limitation: only flat (one-level) statements currently supported.
- Added two new SQL connectors:
- Databricks: personal access token authentication.
- Snowflake: username/password authentication.
- Miscellaneous:
- Reworked UI: new light & dark theme, new dialogs & custom styling experience
- Many stability and responsiveness improvements.
- Introducing the Chat Agent:
May 19, 2025
- Added option to connect a SQL database to Zebra AI!
- Microsoft SQL Server, PostgreSQL and MySQL connections are currently supported.
- Azure access token (SQL Server) and username / password authentication (all 3 connections) supported.
- Data retrieval limited to 10 million values per query.

- Miscellaneous:
- Increased connection timeout limit, your session will now remain active for up to 6 hours.
- Improved server stability.
- Reduced dead clicks on some actions and added minor improvements to UX.
- Fixed bugs related to edge cases in data model causing spurious errors.
- Improved data cleaning AI.
- Added option to connect a SQL database to Zebra AI!
May 5, 2025
- Added Zebra BI Tables to Zebra AI
- From now on, Zebra BI Tables are used by default to represent structural data breakdowns.
- Tables bring in a lot of new functionality to Zebra AI:
- Top N + Others
- Sorting by any chosen column
- Quick column calculations
- Row formulas
- And much more!
- Current limitations:
- Up to 2 measures may be added to Values field
- Up to 1 measure may be added to Previous Year / Plan / Forecast fields respectively
- Row and column hierarchies (groups) are not yet supported
- Some formatting settings, found in Zebra BI Tables for Power BI, are not yet supported in Zebra AI
- The visual may be switched from Zebra BI Tables to Zebra BI Charts at any time via the visual settings.

- Added AI Data Cleaning Agent
- For file data uploads, AI will now automatically detect & resolve issues related to data format requirements for Zebra AI.

- Miscellaneous:
- Improved PPT export slides to include headers, margins & filter context
- Added AI suggestion button to Power BI connection screen (XMLA)
- Minor UX/UI improvements across the application
- Many bugfixes of edge cases & improvements related to stability and data operations
- Added Zebra BI Tables to Zebra AI
March 3, 2025
- Introduced MTD/YTD switch on dashboard

- Visual data field configuration added
- The dimensions and measures displayed on a chart can be edited by clicking on the wheel icon
- The scenarios (Actuals / Previous Year/ Forecast / Plan) can also be altered

- Story exports to PowerPoint now support dynamic Zebra BI for Office visuals:

- Many minor bug fixes & stability improvements.
January 21, 2025
- Introduced new ways of customizing charts on your dashboard:
- Change chart settings through the on-hover menu or remove charts from your dashboard
- Add new charts to an existing dashboard


- Story exports to Excel now display dynamic Zebra BI for Office visuals

- An AI agent automatically recommends columns to use when connecting a Power BI dataset.
- Bug fixes & miscellaneous:
- Fix a bug where measures were not available when connecting to Power BI datasets with visual connector.
- Various minor improvements to drawn visualizations.
- Improved stability & fixed numerous edge cases in data model.
- Introduced new ways of customizing charts on your dashboard: