In this article, we’ll explore the Top 10 features of Zebra AI—our all-in-one, agent-driven analytics SaaS. From automated data cleaning and dynamic dashboards to conversational insights and export-ready reporting, you’ll see how each capability accelerates your journey from raw data to confident business decisions.
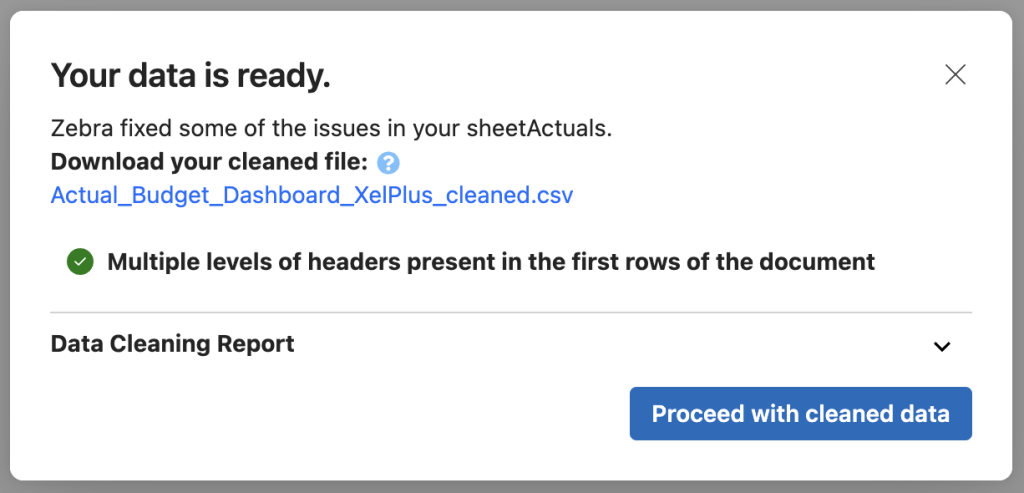
1. Intelligent Data Cleaning
More information here.
Uploading Excel or CSV files often leads to inconsistent formats, missing values, or misaligned data types. Zebra AI’s AI-driven data cleaner automatically identifies these issues, suggests corrections, and generates the precise transformation code needed to standardize your dataset. You can review and approve each fix and download both the cleaned data and the accompanying report including the used code scripts. This seamless process ensures your data is accurate and analysis-ready without hours of manual work.

2. Dynamic Dashboard Filtering & AI Refresh
More information here.
From the moment a dashboard is generated, every chart and table in Zebra AI is fully interactive. Filter across any dimension using the filter bar or by clicking directly on chart elements—your selections instantly reshape the entire dashboard. Once your filter context is set, clicking “AI Refresh” dynamically regenerates chart titles, narratives, and recommendations to reflect your new focus. This real-time synergy between filters and AI commentary ensures your insights are always contextually relevant.

3. Conversational AI Chat & Insight Discovery
Interact with your data as naturally as chatting with a colleague. Ask specific questions—”What drove last quarter’s revenue drop?”—and Zebra AI leverages advanced algorithms and custom code generation to pinpoint key drivers across multiple dimensions. If a prebuilt analysis method falls short, Zebra AI writes and executes tailored scripts on the fly, returning the most compelling insights. This conversational approach accelerates decision-making, helping you uncover hidden patterns in minutes.
4. Transparent AI Context Review
Building trust in AI insights requires visibility into the process. Zebra AI offers a context review icon beside every AI-generated answer, providing a step-by-step breakdown of the data queries, algorithms, and transformations that led to each result. This full transparency empowers you to validate analysis steps, ensuring confidence in every insight.

5. Highly Interactive Visualizations

More information here.
Zebra AI’s visual layer combines the power of Zebra BI Tables and Zebra BI Charts to deliver sophisticated yet user-friendly graphics:
- Visual Slider: Don’t like a specific chart? Just click on the slider on the right hand-side of a visual to instantly switch a bar chart for a line, area, pin or waterfall bridge chart. Customization has never been easier!
- Top N + Others: Automatically display your top performers while grouping the remainder into an “Others” category for concise overviews.
- One-Click Sorting: Instantly sort charts or tables by any measure—ascending or descending—to reveal your highest and lowest values at a glance.
- Row Calculations: Apply row-level transformations like inversions, cumulative totals, or custom result series on the fly without manual formulas, streamlining preparation of your financial statements.
- Axis Breaks: Introduce axis breaks to manage outliers and focus attention on critical data ranges seamlessly.
These enhancements ensure even the most complex datasets remain transparent, engaging, and easy to explore.
6. Intuitive Visual Data Configuration
More information here.
Need to refine a visual? Open the hover-menu “Data Config” to swap fields, add comparisons, or adjust aggregations on the fly. Whether correcting a mislabeled series or introducing new dimensions, you can tailor each visual instantly—no reloading or coding required.

7. Simple Dashboard Editing
More information here.
Customize your dashboard layout in seconds: remove any unwanted visual with the trash-bin icon or add entirely new charts by typing a plain-language request. Describe your desired chart—”Show sales vs. cost by region”—and watch Zebra AI generate the visual instantly, seamlessly integrating it into your story.
8. Export to Excel & PowerPoint
Turn your data story into polished deliverables with two clicks. Export to PowerPoint to receive a slide deck populated with interactive Zebra BI visuals, AI-generated titles, summaries, and preserved filters. Alternatively, export to Excel to obtain a workbook where each sheet contains both the visual and its underlying data, ready for further data editing, fine-tuning and report finalization.
9. Effortless Story Sharing
Collaborate without friction by generating a secure sharing link from the top navigation. Recipients within your organization can view and continue exploring your story, with all access controls and Power BI Row-Level Security respected. Share insights instantly—and securely—with everyone who needs them.
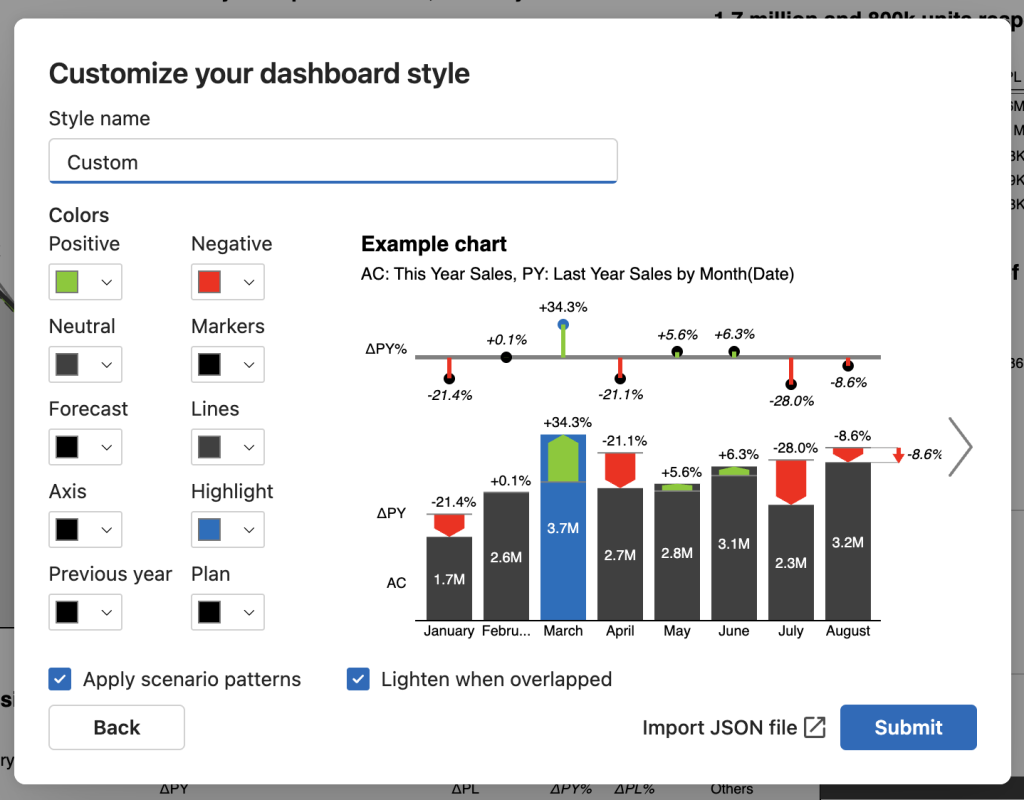
10. Customizable Styling
More information here.
Align every dashboard with your brand guidelines through the sidebar styling menu. Adjust color palettes, fonts, chart elements, and more, or import your existing Zebra BI JSON themes from Power BI or Office. This flexibility ensures your visuals maintain a professional, on-brand look across all reports.