Proper data preparation is essential to get accurate and insightful analytics using Zebra AI. Following these best practices ensures that your data is clean, structured, and optimized for AI-driven analysis. This guide provides step-by-step instructions on how to format your data for the best results.
Zebra AI supports AI-driven analysis of data stored in Excel files, CSV (text) files, as well as connecting to popular databases and Business Intelligence tools such as MS SQL Server, Postgres, or Power BI.
This article describes step-by-step instructions for analyzing data from Excel and CSV files. For AI analysis of your Power BI datasets or connecting directly to databases, please refer to: [link]
Zebra AI is also capable of automatically resolving many issues with your data. However, to achieve most consistent results, ensure your data complies with rules and best practices presented in the following.
Supported File Formats
Zebra BI supports the following file formats:
| File Format | Description |
|---|---|
| Excel (.XLS, .XLSX) | Preferred format, as it retains structured data and metadata needed for accurate analysis. |
| CSV (.CSV) | CSV text files are also supported but require stricter formatting, as CSV does not store metadata such as data types. |
Data Size Limitations
For Excel and CSV files, the following limitations apply:
- Maximum 25 columns (recommended for optimal performance),
- Maximum 1 million rows,
- File size limit: 50 MB.
General Formatting Guidelines
The optimal data structure for AI-driven analysis is a flat table where the first row contains descriptive column names (headers):
When preparing data for AI analysis in Excel, please check the following rules:
- The entire dataset should reside in a single sheet.
Zebra AI currently does not consolidate data across multiple sheets. Make sure that the entire dataset resides on just one of the sheets, ideally on the first worksheet in your Excel file. - The data should start from cell A1.
Zebra AI will try to detect where your table is placed on the worksheet. However, the safest option is to have your data start in the top left cell (A1). Make sure that there is no additional text, additional headers, or labels above the table. - Avoid adding titles, subtitles, footnotes, or summaries outside of the dataset.
- Ensure column names are clear, meaningful, and not excessively long.
Data Structure Best Practices – 7 Golden Rules
1. Column names (Headers)
- The first row should always contain column headers:
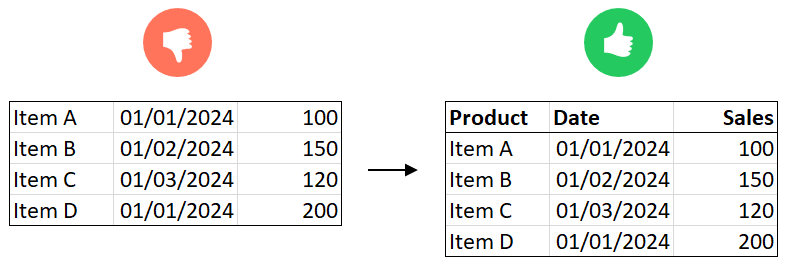
- Column names should be concise and descriptive (e.g., “Sales Revenue” instead of “Rev_Sales_2023”).
- Avoid merged cells or multiple header levels.
2. Data Organization
- Each row should represent a unique record, without subtotal or grand total rows:
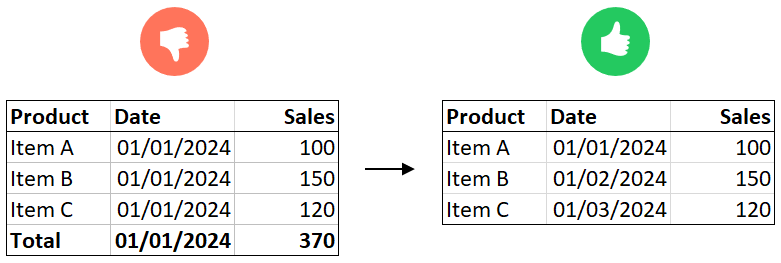
- Categories and hierarchies should be repeated per row (e.g., “Product Category” should appear in every row rather than grouped in a separate section).
- Keep the data granular, meaning raw, non-aggregated figures.
- Remove empty rows and columns within the dataset.
3. Handling Dates & Time Data
- Dates should be in a single column and formatted properly as date types.
- Avoid storing dates horizontally (e.g., “Jan, Feb, Mar” in different columns) – keep them in a single column.
- Ensure your dataset includes at least two years of historical data so Zebra AI can automatically generate year-over-year comparisons for deeper, actionable insights.
- Zebra AI can automatically recognize and interpret standard date formats.
- No need to add additional time-related columns (e.g., year, month, quarter) – Zebra AI will generate them automatically.
- Fiscal year columns are not currently supported but will be added in future updates.
4. Numerical Data (Measures & KPIs)
- Ensure numerical data is properly formatted as numbers.
- No non-numeric values in numerical columns (e.g., no “N/A” or “-”). Non-existing values should be represented by empty cells.
- Zebra AI supports automatic aggregation, so avoid including manually aggregated values.
- Business measures (KPIs) should be clearly separated from categorical values.
- Stock measures (e.g., balance amounts) should be structured properly so that Zebra AI can aggregate them over time.
- Be cautious with percentage-based measures – avoid pre-calculated percentages and instead provide the raw values.
5. Categories and Dimensions
- Ensure categorical data is consistent (e.g., use “M” and “F” instead of “1” and “2” for gender).
- Zebra AI can recognize categorical values automatically, but you can manually define them if needed.
- Include multiple dimensions (e.g., product categories, regions, customer types) to allow Zebra AI to perform deep analysis.
- The more categories you include, the better Zebra AI can identify patterns.
6. Scenario and KPI Handling
- Zebra AI can automatically recognize and pivot scenario columns (e.g., “Actual,” “Plan,” “Previous Year”).
- Ensure these values are clearly labeled and stored in a single column.
- The system can also automatically recognize KPI columns, allowing it to differentiate between different business metrics.
7. Duplicate Rows
- Zebra AI will automatically aggregate duplicate rows if the dimension values match but measures differ.
- This helps maintain data integrity, but always verify that duplicate rows are intentional.
Practical Example: Cleaning a Dataset
Example: Bad Data Format
| Product | Jan | Feb | Mar |
| Item A | 100 | 150 | 120 |
| Item B | 200 | 180 | 210 |
Correct Format
| Product | Date | Sales |
| Item A | 2024-01-01 | 100 |
| Item A | 2024-02-01 | 150 |
| Item A | 2024-03-01 | 120 |
| Item B | 2024-01-01 | 200 |
| Item B | 2024-02-01 | 180 |
| Item B | 2024-03-01 | 210 |
Example: Proper Date Formatting
Incorrect:
| Date | Revenue |
| 01/15/24 | 1500 |
| 15/01/2024 | 1600 |
Correct:
| Date | Revenue |
| 2024-01-15 | 1500 |
| 2024-01-16 | 1600 |
Future Improvements
- Enhanced Date & KPI Recognition: More flexibility in date parsing and automatic KPI impact detection.
- Improved Scenario Handling: Advanced handling of fiscal years and additional scenario comparisons.
By following these best practices, you ensure that your data is optimized for Zebra AI, allowing you to generate accurate, insightful analytics with minimal manual effort.