Make dashboards answer the exact question you have by filtering the data. Zebra AI offers intuitive filter controls, chart‑driven filtering, and a time switcher (MTD/YTD). Filters update all visuals and can optionally regenerate AI text to reflect the filtered context.
Where you filter
- Filter Bar: At the top of the dashboard. Add/remove filters, choose values, and toggle MTD/YTD.
- Charts: Click data points to filter the entire dashboard by that value.
Add and manage filters
- Add a filter column
- Open the filter bar’s add menu and pick a column.
- Zebra AI fetches unique values for the column.
- Select values
- Click values to select one.
- Hold Ctrl/Cmd to multi-select.
- Date columns are formatted automatically.
- Pin/Unpin
- Pin keeps a filter visible even with no values selected.
- Remove
- Use the trash icon to remove a column from the filter bar.
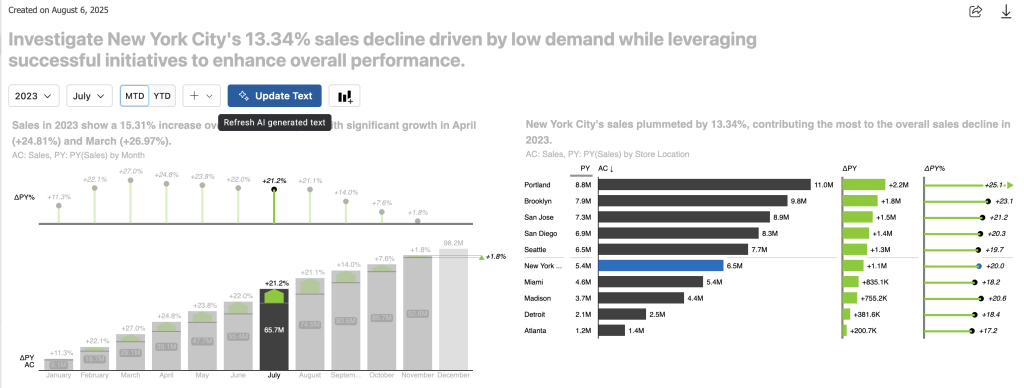
- Apply / Update Text
- Charts refresh immediately on selection.
- Click Apply/Update Text to also regenerate AI-generated insights (summary, titles, advice).
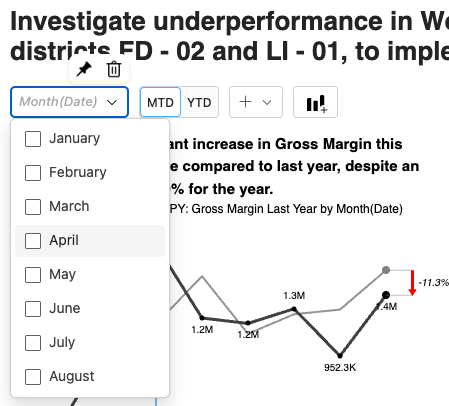
MTD/YTD switcher (time filters)
Add the special “MTD/YTD” item from the filter bar’s add menu to quickly switch between Month‑to‑Date and Year‑to‑Date views. You’ll see this option offered when your data includes a clear month field and you haven’t already added the switcher. Once added, the toggle appears in the bar; you can remove it anytime, and it will reappear in the add menu as long as your data still includes a month field. When you switch MTD/YTD, Zebra AI aligns the date logic across all visuals.
Filter behavior and scope
- Global filters: Values you choose in the filter bar (and chart clicks) apply across the whole dashboard.
- Local (initial) filters: Some charts come with an initial filter context. Global filters override these; any non-overridden local filters still apply.
- Same-dimension behavior: When you filter by a column that is also a chart’s category axis, Zebra AI keeps that chart visible (does not self-filter it) while filtering other charts.
Chart-driven filtering
- Click a bar, line point, or table selection to filter the dashboard by that value.
- Selections propagate across visuals. Charts using the same categorical dimension reflect the selection without hiding themselves.
Persistence and sessions
- Filter bar state (columns, pins, values, MTD/YTD) is saved with your dashboard session.
- On reconnect or refresh, your filter context is restored when possible.
How it works under the hood
- Your selections build a dashboard filter context.
- Charts refresh using the filter context; date filters are normalized (and corrected for YTD when on).
- If you click Apply/Update Text, the AI regenerates all text using the filtered data so answers and titles match what you see.
Tips
- Start broad (Country, Product).
- Use Ctrl/Cmd for multi-select.
- Toggle YTD for year‑to‑date; MTD for current‑month focus.
- After setting filters, click Apply/Update Text to align AI insights.
Troubleshooting
- Filtering disabled: reconnect the data source.
- Interaction limit reached (trial/licensing): upgrade to continue.
- Too many filters: remove or unpin to declutter.
FAQ
- Do filters affect the AI’s answers?
- Yes—after you click Apply/Update Text, the AI regenerates insights using the current filters.
- Can I multi-select values?
- Yes. Hold Ctrl/Cmd while selecting values in a filter dropdown.
- Will filtering one chart hide that chart?
- No. Zebra AI avoids “self-filtering” on charts that use the same categorical dimension, so you can still see context.