Zebra AI allows you to deeply customize your story dashboards through an intuitive interface.

What you can do
- Add charts to the dashboard
- Edit charts (data, fields, visuals)
- Change visual settings and styles
- Move charts around the grid
- Resize charts
- Delete charts
Add a chart
- Open a dashboard.
- In the “Add chart” bar, describe what you want (e.g., “Sales by month vs last year”).
- Submit. Zebra AI will generate a chart based on your data and current filters.
- The new chart appears on the grid. You can immediately move, resize, or edit it.
Notes:
- Your current filter context influences the result (e.g., YTD switch, dimension filters).
- If there are existing charts, Zebra AI also considers their filter context for consistency.
Edit a chart
Hover a chart (desktop) or tap once (touch devices) to reveal the chart editor.
- Config tab (data configuration):
- Drag-and-drop fields between buckets like Category, Values, Previous Year, Plan, Forecast.
- Reorder items within a bucket to change sorting or series order.
- Add data via the Add Data option when shown.
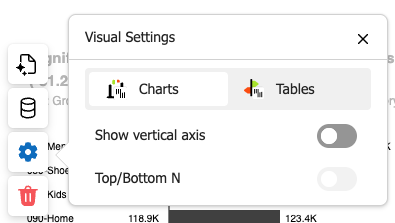
- Settings tab (visual customization):
- Switch between Zebra BI Tables and Zebra BI Charts.
- Configure additional visual-specific settings.
Zebra BI Tables and Zebra BI Charts are powerful visuals with countless customization settings found on the visuals themselves! For more details, check out this guide on Zebra BI Tables and Zebra BI Charts within Zebra AI.

Move charts
- Desktop: drag a chart tile to reposition it on the grid.
- Mobile/tablet: use the visible drag handle to move tiles.
- The grid snaps charts to the layout automatically.
Auto-save: Your layout changes are saved when you stop dragging.
Resize charts
- Drag a chart’s edge or corner to resize.
- On mobile, resize handles are shown explicitly; on desktop, hover near edges/corners.
- Charts and tables re-render to fit their new size.
Auto-save: Size changes are saved when you stop resizing.
Delete a chart
- Open the chart editor and select the trash/delete icon.
- The chart is removed from the dashboard.
Filters and context
- Use the filter bar above the dashboard to set global filters (dimensions, YTD switch, etc.).
- Zebra AI respects these filters for new charts and when regenerating data.
Tips for better results
- Be specific in your “Add chart” prompt (metric, breakdown, time period, comparison).
- Use the Config tab to fine-tune fields if Zebra AI didn’t place them where you expect.
- Use Settings to align style and readability (titles, labels, color scheme).
- Rearrange and resize to highlight priority visuals.