Product update — July 2026
Everything we shipped recently
Zebra AI turns a dataset into a dashboard you can question in plain language. Over the past few months we shipped a set of changes that make the first result better, the workspace easier to keep organized, and the whole thing more useful for teams outside finance too. Here is everything that is new.
01 — Data structure
Hierarchies, built automatically from your data
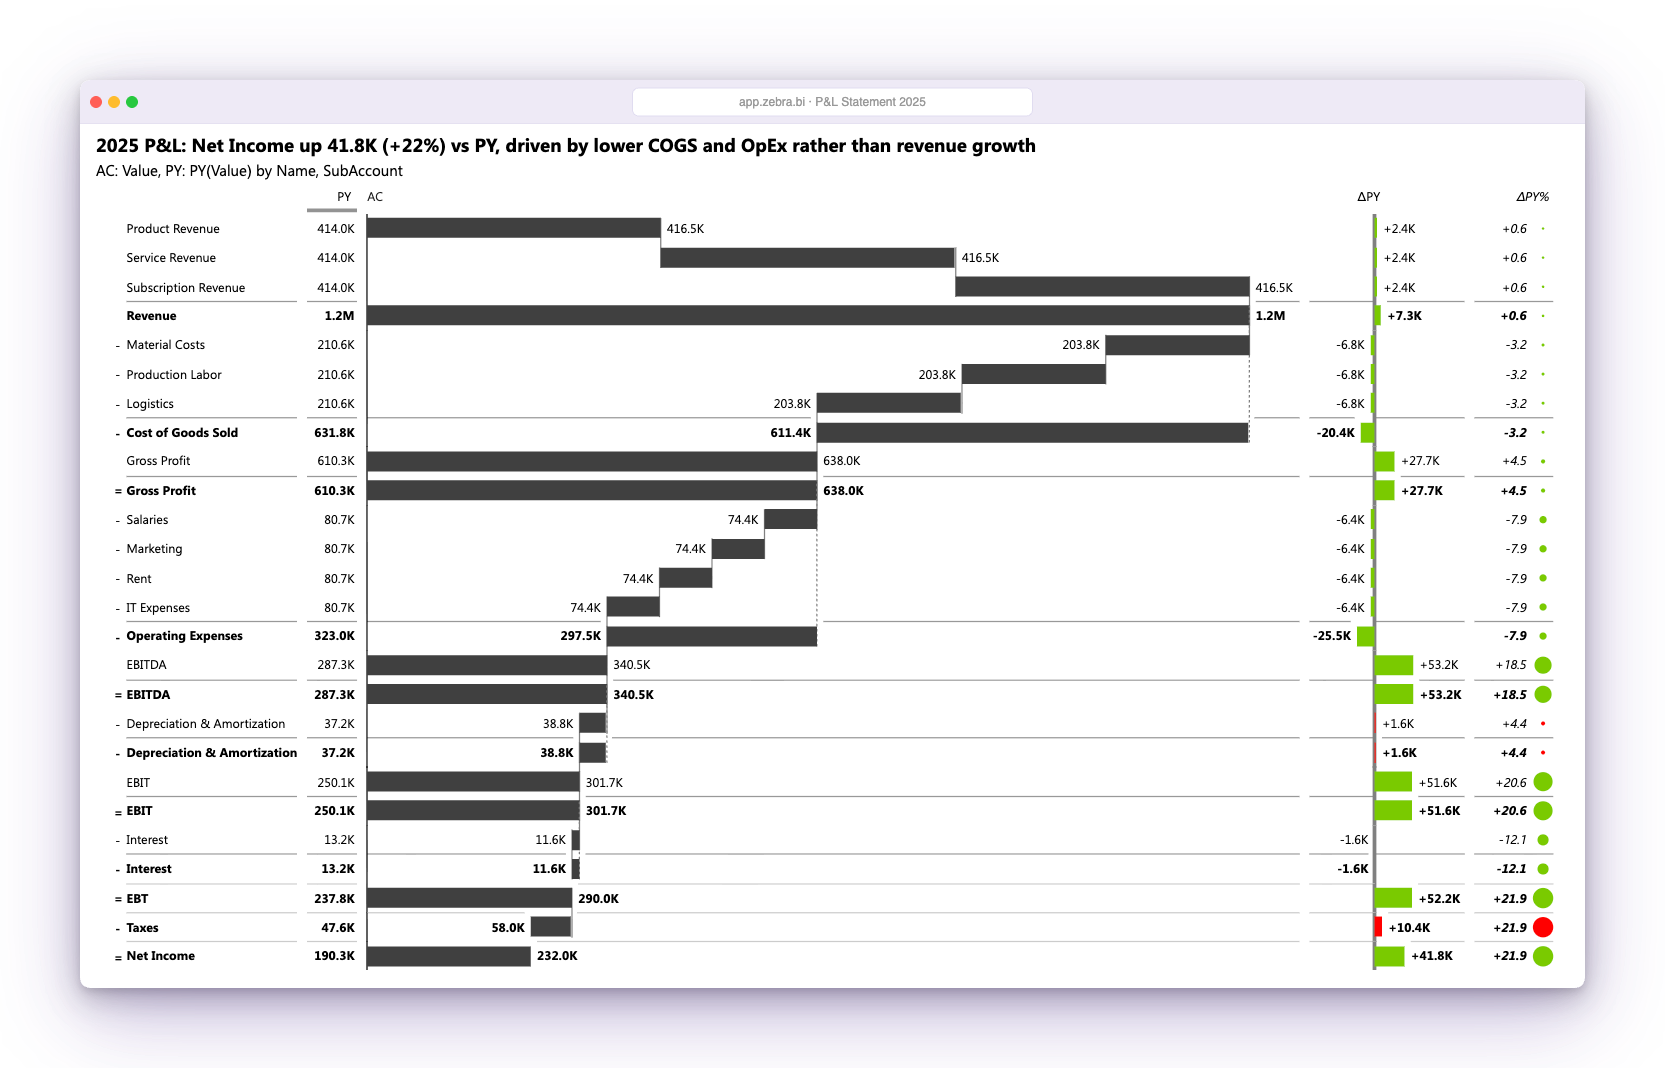
Region rolls into subregion. Cost center rolls into category. Zebra AI now picks up that structure automatically and applies it in your tables and dashboards, two levels deep, so you can expand and collapse as you go instead of losing the structure the moment you upload.
This is also what makes real income statements possible. Zebra AI now generates a full P&L waterfall from revenue down to EBITDA, with sort order, subtotals, and row logic already in place. The kind of statement that used to take an analyst an afternoon shows up the moment your data lands.
Why it matters
Finance teams get accurate P&L, balance sheet, and cash flow rendering without manually rebuilding hierarchy logic every time. Everyone else gets dashboards that respect the real structure of their data instead of flattening it.
02 — Dashboards
A sharper dashboard, end to end
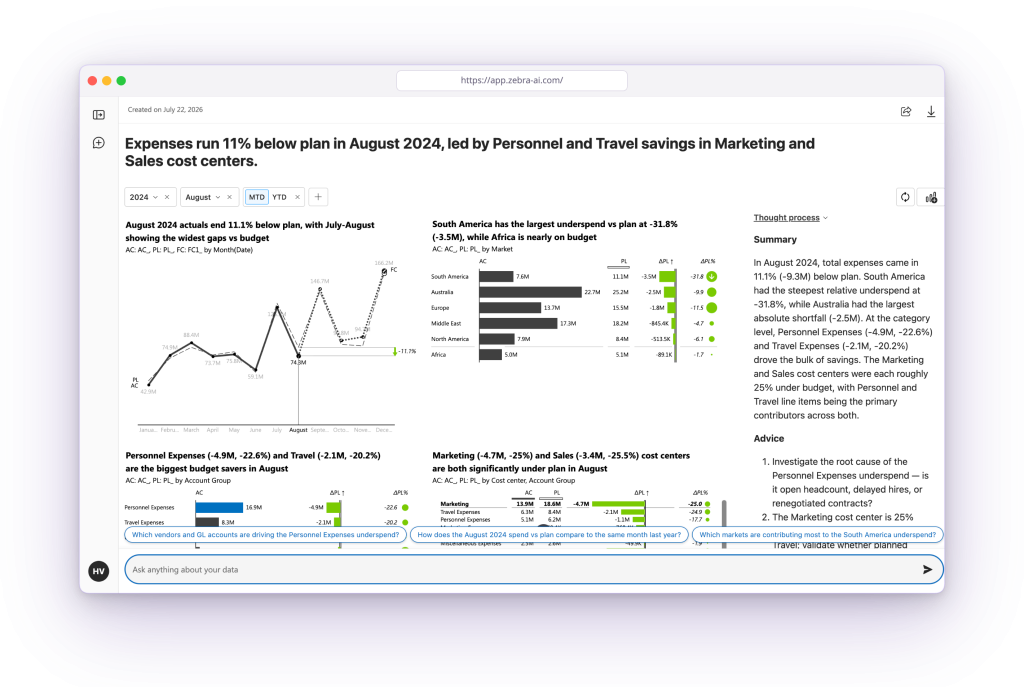
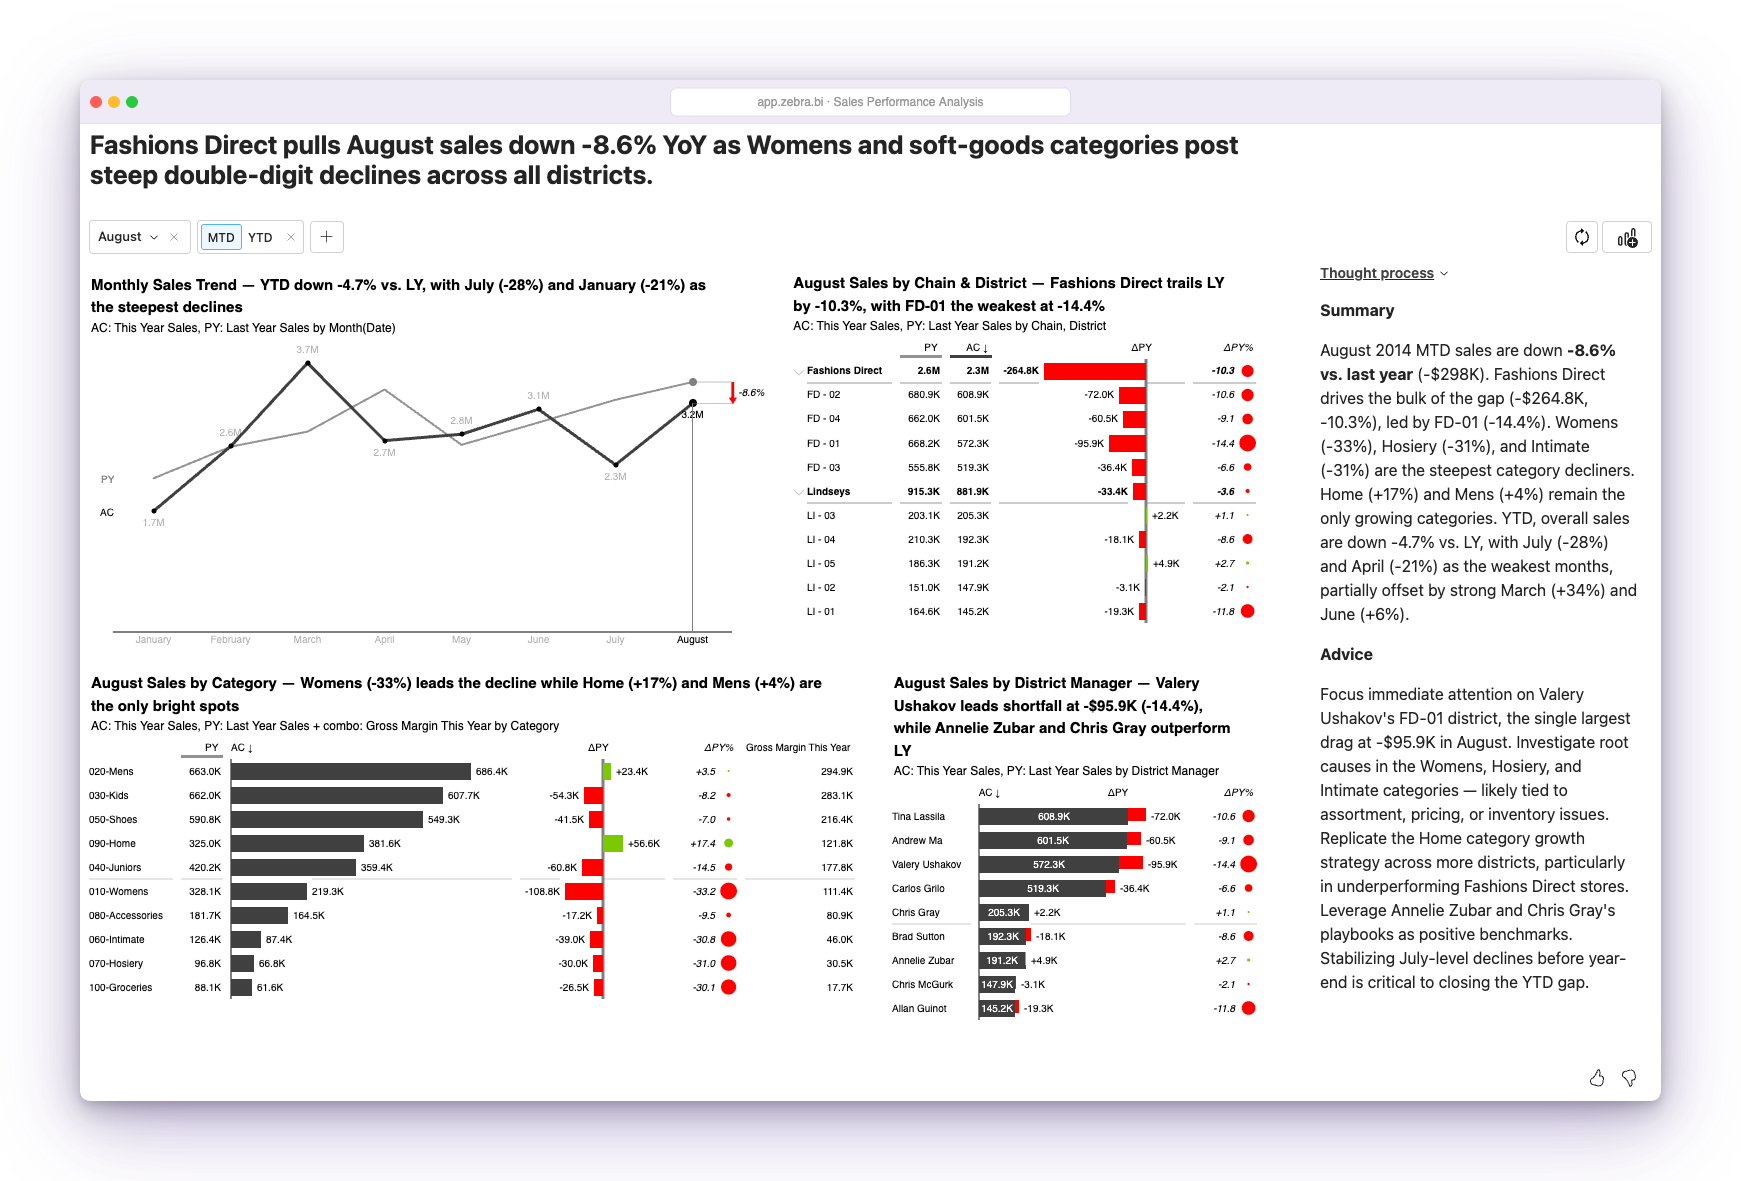
We rebuilt dashboard generation from the ground up. The new flow is one autonomous agent that reasons through your data, proposes an analysis and dashboard plan, and lets you preview and adjust it before anything gets built, instead of the old rigid one-shot process.
The result: charts fit the insights better, layouts are tighter, titles are clearer, and every card carries more signal. The first dashboard you see is much closer to the one you would have built yourself.
Why it matters
Less time reworking the default output, more confidence the first version is usable, and better alignment on complex or non-standard datasets.
03 — Language
Works in your team’s language
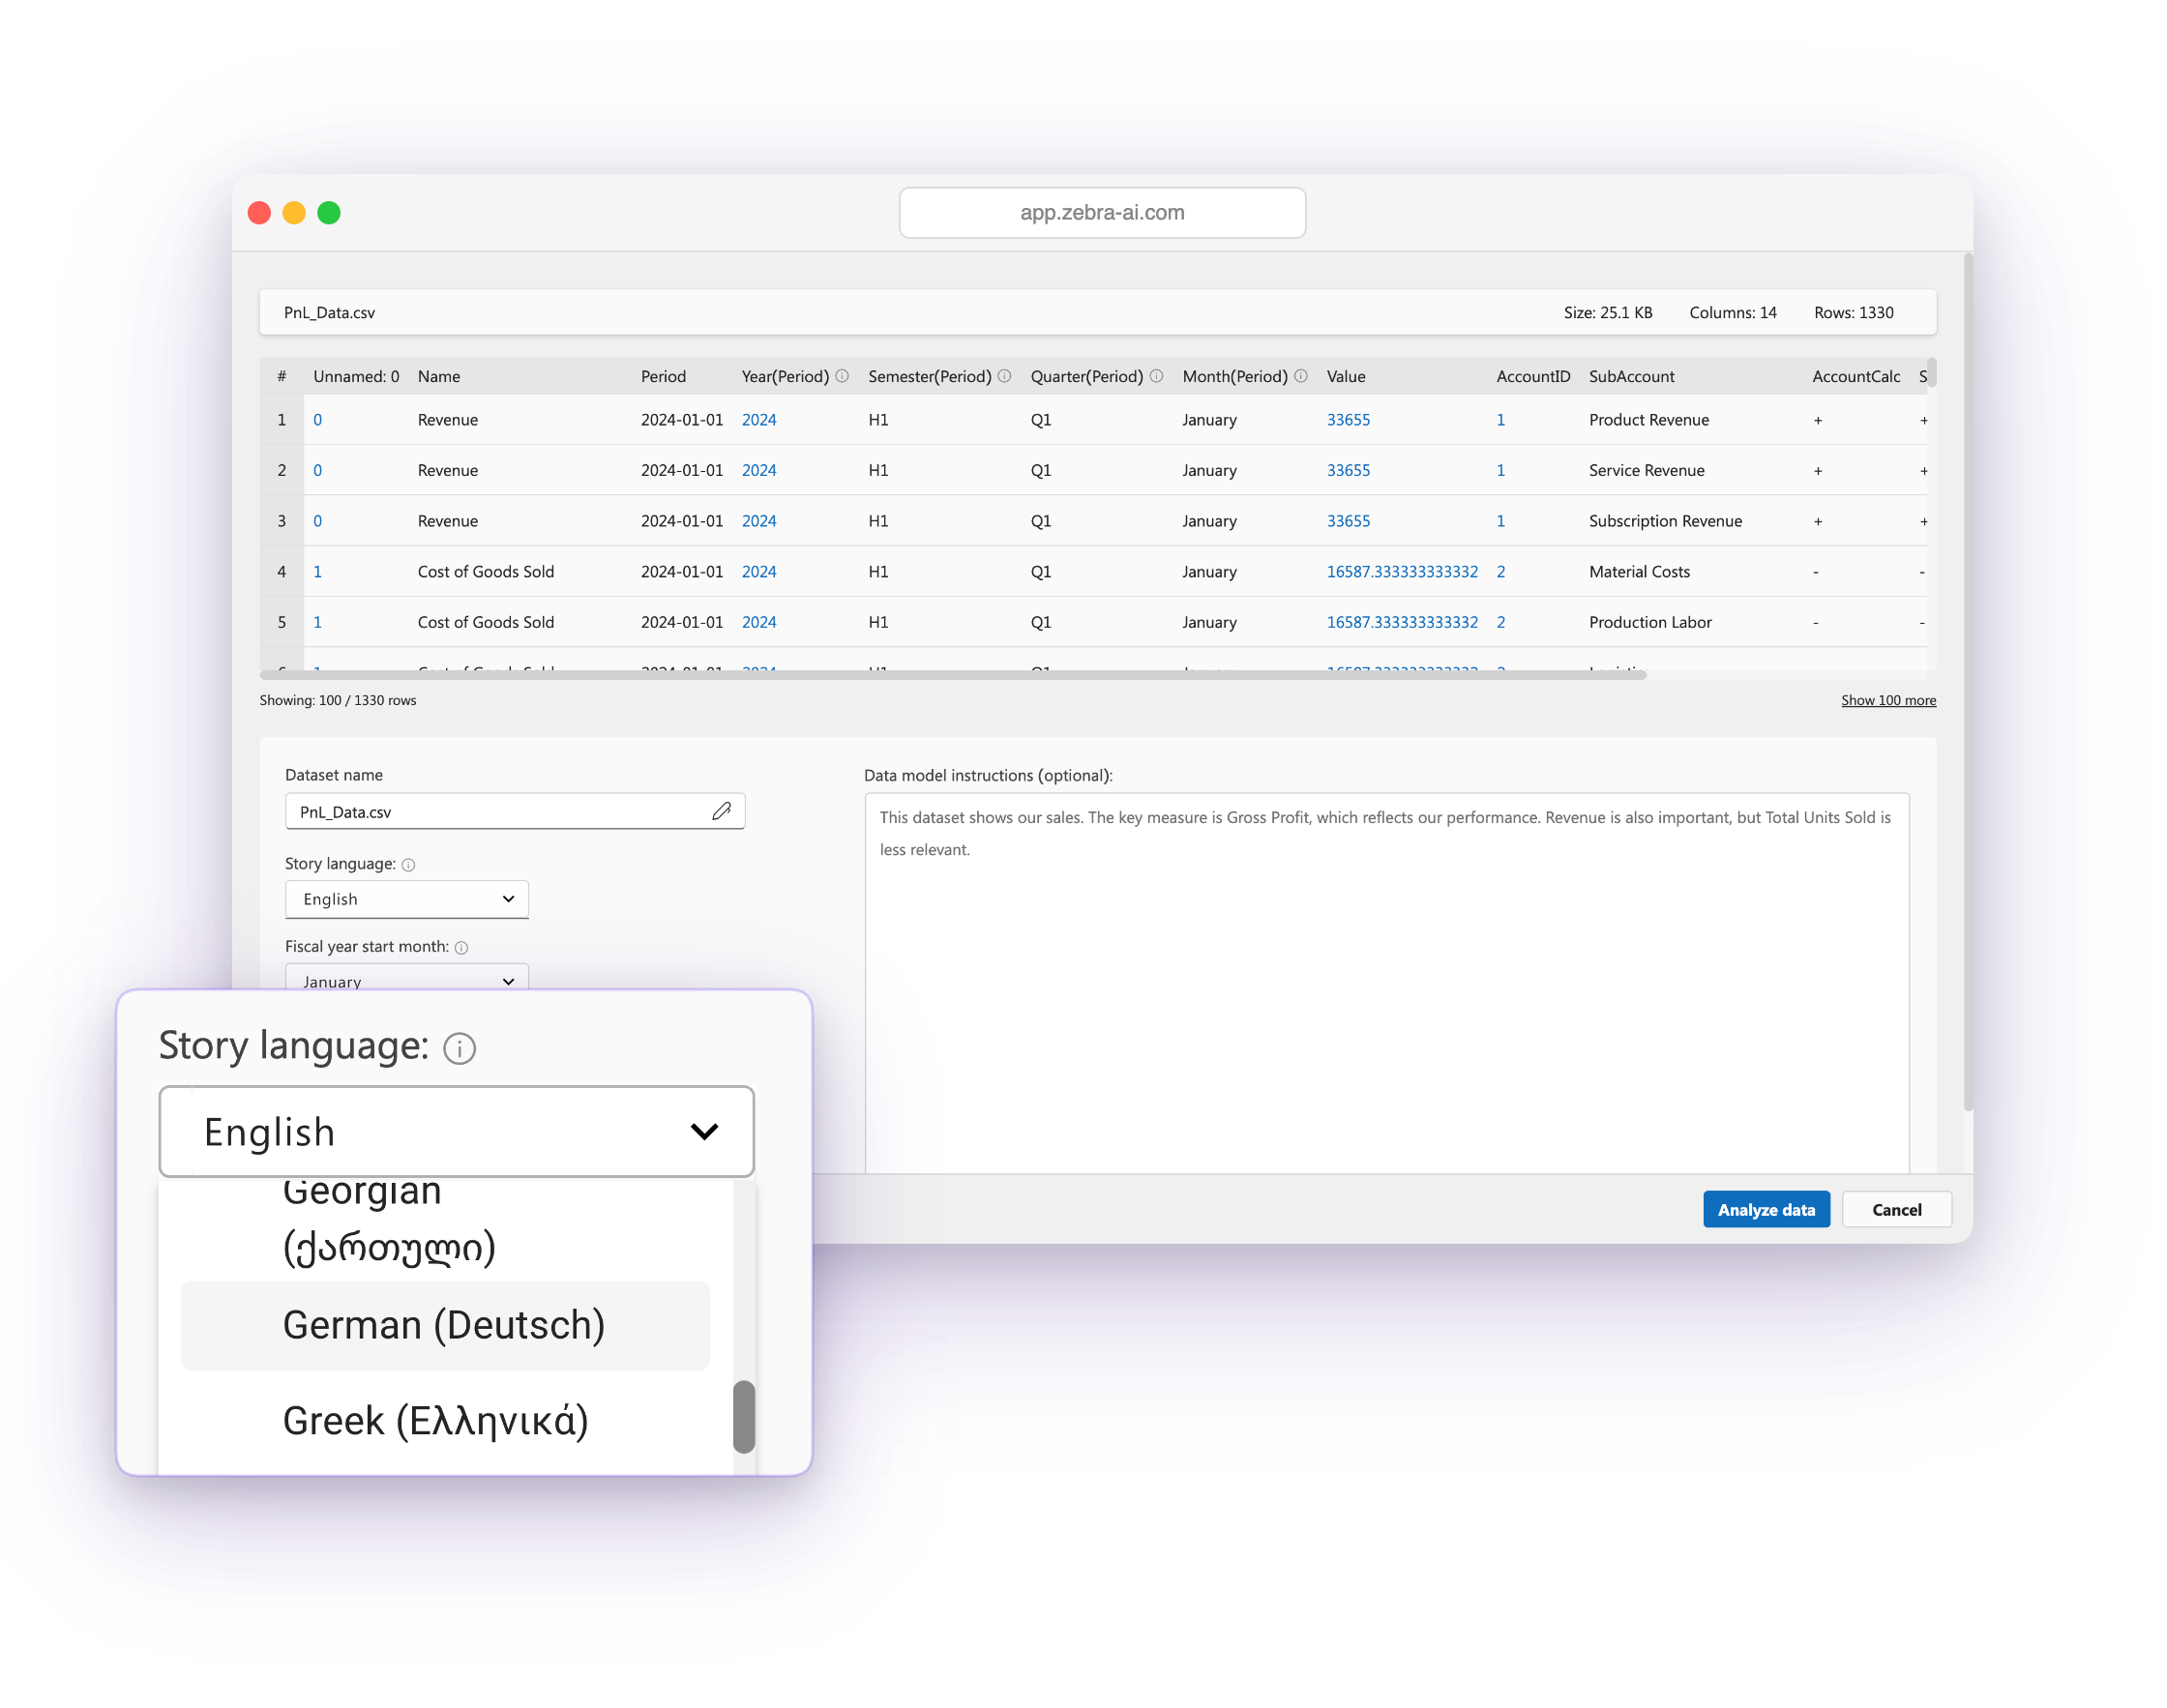
Chart titles, summaries, commentary, and chat answers now render in the language you choose. Pick your language on any new story and Zebra AI writes everything to match, so the output is ready to share with a team that reads in German, Spanish, French, or anything else.
Why it matters
No more translating chart titles and summaries by hand before sharing analysis with a team that does not work in English.
04 — Organization
Projects: a home for your stories
A simple folder system for organizing your stories by client, campaign, quarter, or analysis type.
- Create, rename, and delete folders
- Move stories in and out anytime
- Folders are organization only, so they do not change access or sharing
- Deleting a folder never deletes the stories inside it. They move back to the root.
- Sorting is alphabetical in this first version
Why it matters
As your story count grows, your workspace stays findable instead of turning into a flat, noisy list.
05 — Data setup
Edit your dataset connection anytime
Previously, adding or removing a column meant starting over. Now you can revisit your Power BI or SQL dataset setup anytime and adjust the column selection without rebuilding a story from scratch.
How it works
- Click “Edit selected columns” from within a story
- Confirm on the short explainer that covers what happens next
- The column picker opens, pre-filled with your current selection
- Add or remove columns, then click “Create new story”
- Zebra AI regenerates the dashboard and chat baseline into a new version
- Your original story stays intact and accessible, so nothing is lost
If the regeneration fails for any reason, your original version is untouched and you can retry.
Why it matters
No more losing an afternoon of analysis because a source column changed.
Enterprise
Managed Application for enterprise deployment
For customers who need on-premise or tenant-controlled deployment for compliance, data residency, or governance reasons, Zebra AI now offers an Azure Managed Application option. It deploys into your own tenant, your data stays with you, and authentication runs through your own Microsoft identity provider.
Also new
Smaller improvements that shipped alongside
Custom calculation detection
Choose automatic AI detection, read from an existing column, or turn it off.
Data label units
Control abbreviation on data labels (Auto, full numbers, or K/M/B).
Pre-inverted measures
Variance colors stay correct for costs that are already flipped.
Language toggle in preview
Set your output language before you even see the first dashboard.
Related dataset on story menu
See at a glance which dataset any story was built from.
Column filter search
Find values quickly in long filter lists.
PowerPoint export
Chat final answer now appears in speaker notes, matching the email design.
Excel export
Now includes the question, the answer, and a Story Overview sheet.
Refresh protection
Zebra AI detects manual edits on refresh and asks whether to keep or overwrite them, instead of silently discarding changes.
Standards
Charts that meet the international reporting standard
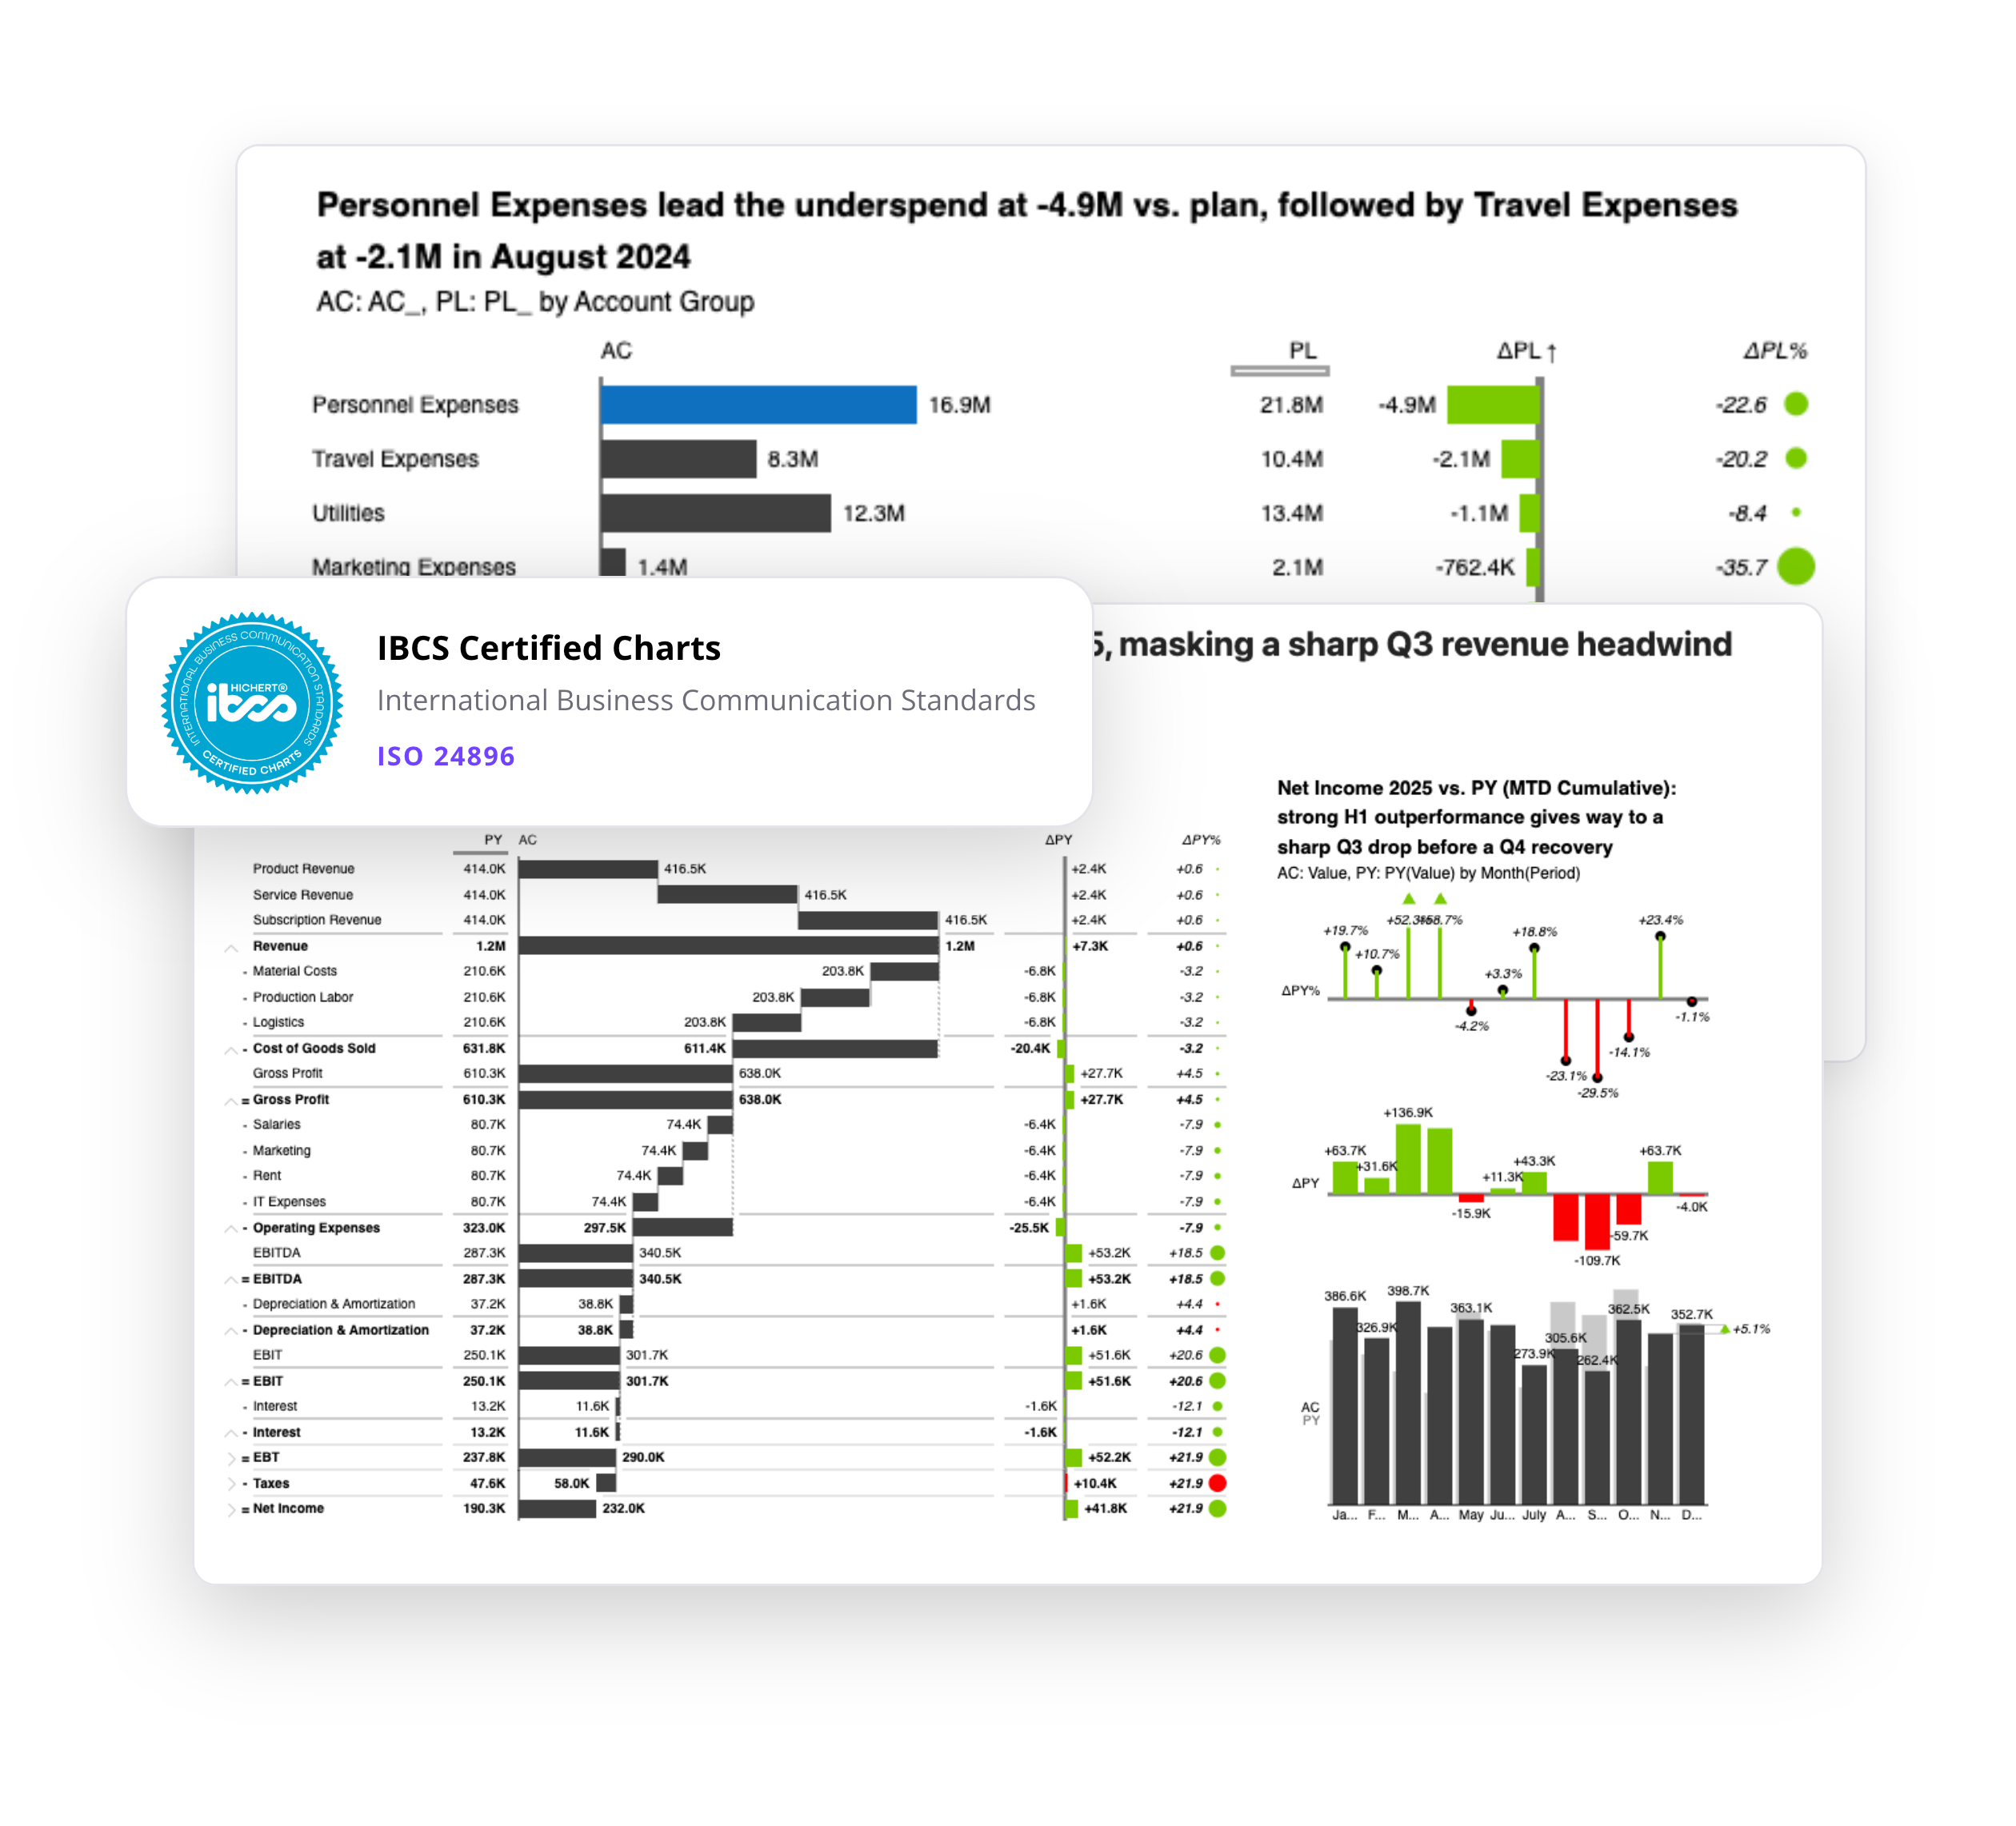
Every chart Zebra AI produces follows IBCS, the international business communication standard, now formalized as ISO 24896:2026. Consistent scales, meaningful colors, and layouts designed so comparisons are obvious at a glance, whether you are reading your own dashboard or one built by someone else on your team.
All of this is live in your workspace right now
Open the app to see it, or start a free trial if you are new.
Open Zebra AI